
PlotJuggler - ZMQ - Python 最小数据源示例
以下示例作为使用 Python 和 ZeroMQ 为 PlotJuggler 开发自定义数据源的起点。
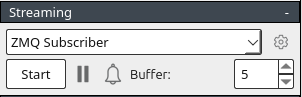
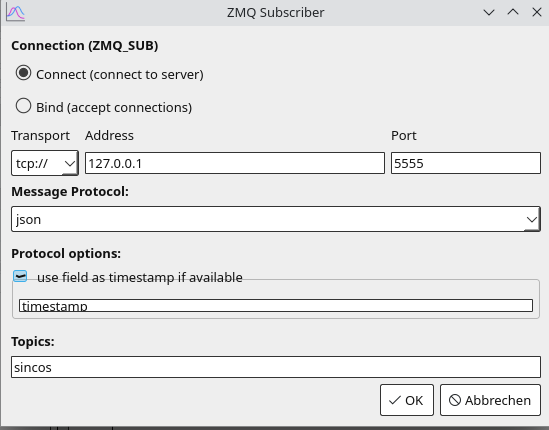
要使用它,按如下方式配置 PlotJuggler
plotjuggler_zmq_producer.py
import zmq
import time
import json
import math

# ZeroMQ setup
context = zmq.Context()
socket = context.socket(zmq.PUB)
socket.bind("tcp://*:5555")  # Bind to a port PlotJuggler will connect to

# Generate and send data
time_start = time.time()
try:
    while True:
        elapsed_time = time.time() - time_start
        value = {
            "timestamp": elapsed_time,  # Zeit in Sekunden seit Scriptstart
            "variables": {
                "sin": math.sin(elapsed_time),  # Sinuswelle
                "cos": math.cos(elapsed_time),  # Kosinuswelle
            },
        }

        # Sende Daten als JSON mit dem Thema "sincos"
        socket.send_string("sincos", zmq.SNDMORE)
        socket.send_string(json.dumps(value))
        time.sleep(0.01)  # 100 Hz Update-Rate
except KeyboardInterrupt:
    print("Datenstrom unterbrochen.")
finally:
    socket.close()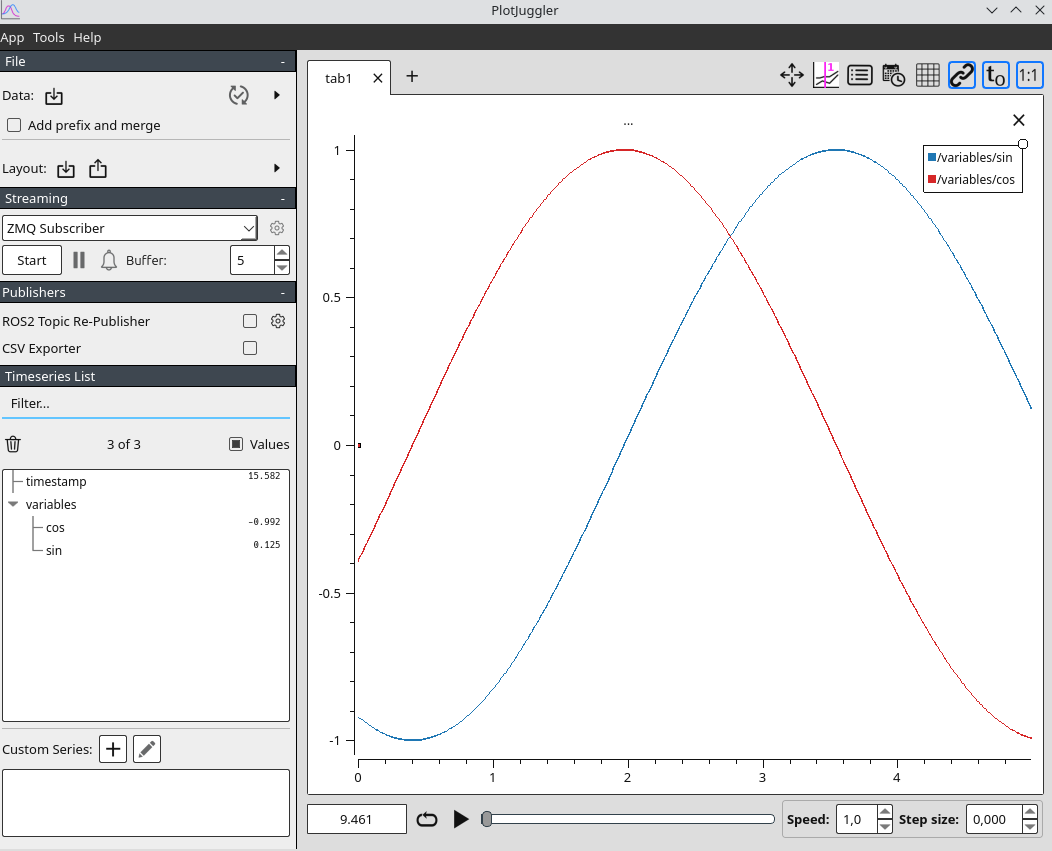
context.term()现在在流式传输选项卡中点击 Start,不要忘记将 sin 和 cos 变量拖到绘图中。
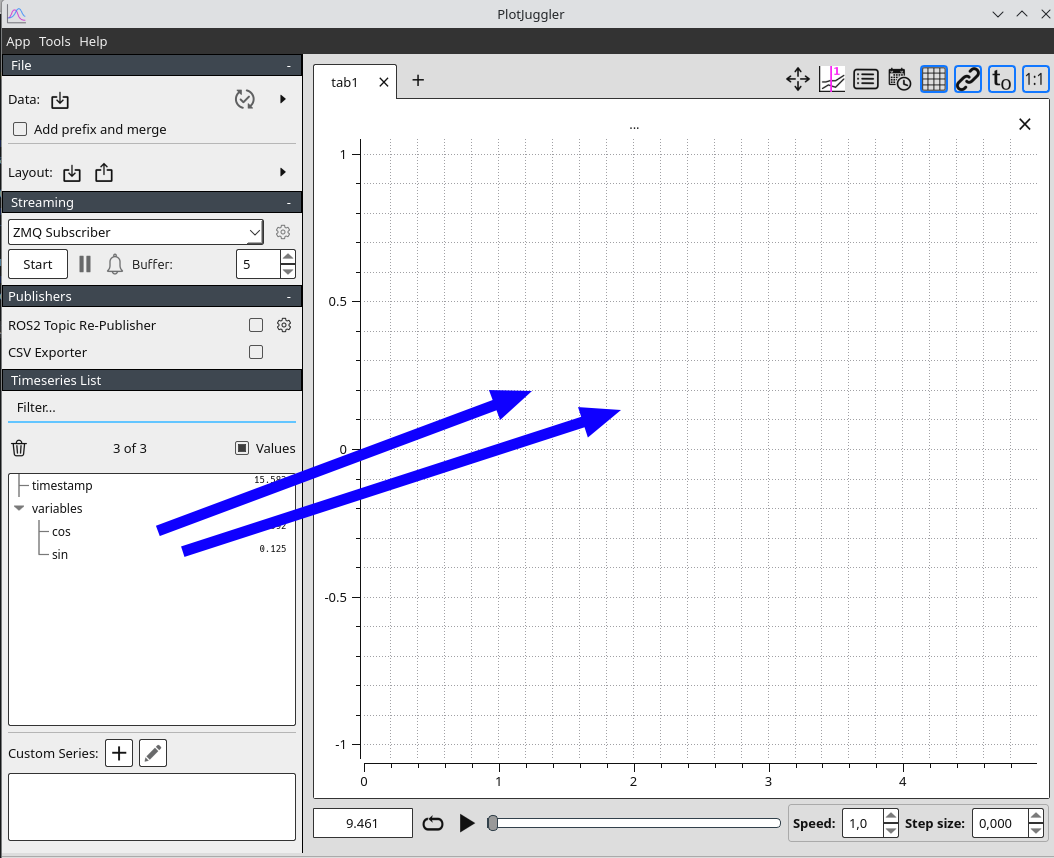
输出示例
If this post helped you, please consider buying me a coffee or donating via PayPal to support research & publishing of new posts on TechOverflow