
How to compute VFT viscosity in Python using UliEngineering
You can easily compute the VFT (Vogel-Fulcher-Tammann) viscosity of liquids using the UliEngineering Python library. The VFT equation is a three-parameter model that provides excellent accuracy for describing the temperature dependence of viscosity, especially for glass-forming liquids:
from UliEngineering.Physics.Viscosity import vft_viscosity, CommonLiquids
from UliEngineering.EngineerIO import *

# Compute VFT viscosity of water at 20°C
T = 20 + 273.15  # Convert to Kelvin
eta = vft_viscosity(T, CommonLiquids.Water.vft)
print(f"Water viscosity at 20°C: {format_value(eta, 'Pa·s')}")

# Compute VFT viscosity of ethanol at 50°C
T = 50 + 273.15
eta = vft_viscosity(T, CommonLiquids.Ethanol.vft)
print(f"Ethanol viscosity at 50°C: {format_value(eta, 'Pa·s')}")

# Using custom VFT constants
from UliEngineering.Physics.Viscosity import VFTConstants
custom = VFTConstants(name="Custom liquid", A=1.0e-5, B=500.0, T0=120.0)
eta = vft_viscosity(300.0, custom)
print(f"Custom liquid viscosity at 300K: {format_value(eta, 'Pa·s')}")Example output
Water viscosity at 20°C: 1.00 mPa·s
Ethanol viscosity at 50°C: 1.06 µPa·s
Custom liquid viscosity at 300K: 2.38 mPa·s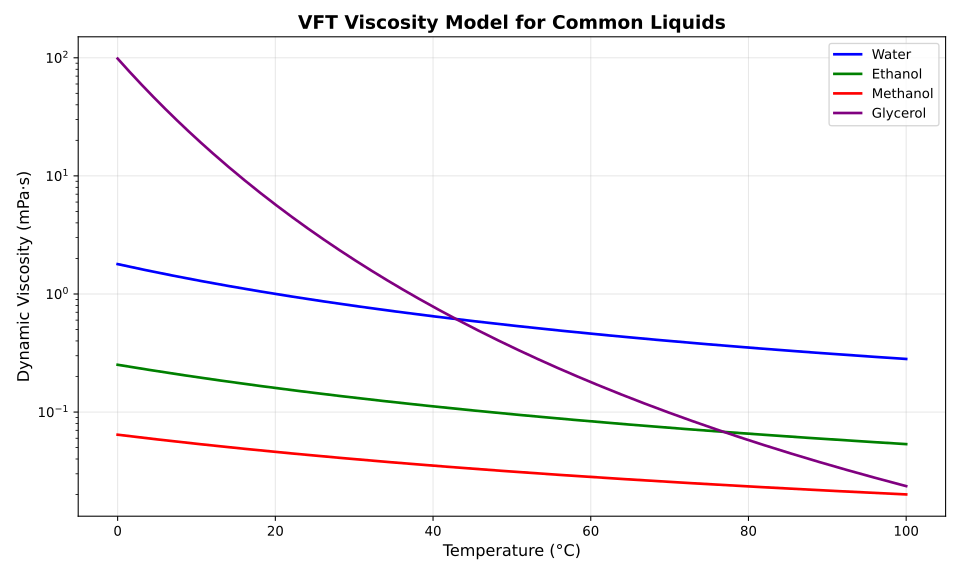
The VFT equation is given by:
$$ \eta = A \cdot \exp\left(\frac{B}{T - T_0}\right) $$where $\eta$ is the dynamic viscosity, $T$ is the absolute temperature in Kelvin, $A$, $B$, and $T_0$ are material-specific constants. The parameter $T_0$ is called the Vogel temperature and represents the temperature at which the viscosity would theoretically diverge to infinity.
The VFT model is particularly accurate for glass-forming liquids and supercooled liquids because it captures the non-Arrhenius behavior near the glass transition temperature. The plot above shows the VFT viscosity model for several common liquids over a temperature range from 0°C to 100°C.
The UliEngineering library provides pre-defined VFT constants for common liquids like Water, Ethanol, Methanol, Glycerol, Olive Oil, Mercury, Acetone, and Benzene through the CommonLiquids class.
Related posts
- How to compute Andrade viscosity in Python using UliEngineering
- How to compute Sutherland gas viscosity in Python using UliEngineering
- How to compute Swindells viscosity in Python using UliEngineering
Plot generation script
#!/usr/bin/env python3
import matplotlib.pyplot as plt
import numpy as np
import sys
sys.path.insert(0, '/home/uli/dev/UliEngineering')

from UliEngineering.Physics.Viscosity import (
    vft_viscosity,
    CommonLiquids,
)

# Temperature range in Celsius for plotting
T_C = np.linspace(0, 100, 200)  # 0 to 100°C
T_K = T_C + 273.15  # Convert to Kelvin

# Create plot
plt.figure(figsize=(10, 6))

# Plot for different common liquids
liquids_to_plot = [
    ('Water', CommonLiquids.Water.vft, 'blue'),
    ('Ethanol', CommonLiquids.Ethanol.vft, 'green'),
    ('Methanol', CommonLiquids.Methanol.vft, 'red'),
    ('Glycerol', CommonLiquids.Glycerol.vft, 'purple'),
]

for name, constants, color in liquids_to_plot:
    eta = vft_viscosity(T_K, constants) * 1000  # Convert to mPa·s
    plt.plot(T_C, eta, label=name, color=color, linewidth=2)

plt.xlabel('Temperature (°C)', fontsize=12)
plt.ylabel('Dynamic Viscosity (mPa·s)', fontsize=12)
plt.title('VFT Viscosity Model for Common Liquids', fontsize=14, fontweight='bold')
plt.legend(loc='upper right', fontsize=10)
plt.grid(True, alpha=0.3)
plt.yscale('log')  # Log scale because viscosities span orders of magnitude

plt.tight_layout()
plt.savefig('vft_viscosity_plot.svg', format='svg', dpi=300)
print("Plot saved to vft_viscosity_plot.svg")