
How to compute Reynolds number in Python using UliEngineering
You can easily compute the Reynolds number using the UliEngineering Python library. The Reynolds number is a dimensionless quantity that predicts flow patterns in fluid dynamics:
from UliEngineering.Physics.Viscosity import reynolds_number
from UliEngineering.EngineerIO import *

# Compute Reynolds number for water flow in a pipe
density = 998.2  # kg/m³ (water)
velocity = 1.0  # m/s
characteristic_length = 0.01  # 1 cm (pipe diameter)
viscosity = 0.001  # Pa·s (water)

Re = reynolds_number(density, velocity, characteristic_length, viscosity)
print(f"Reynolds number: {Re:.0f}")

# Compute Reynolds number for air flow
density = 1.225  # kg/m³ (air)
velocity = 10.0  # m/s
characteristic_length = 0.1  # 10 cm
viscosity = 1.8e-5  # Pa·s (air)

Re = reynolds_number(density, velocity, characteristic_length, viscosity)
print(f"Air Reynolds number: {Re:.0f}")

# Compute Reynolds number for glycerol flow
density = 1261.0  # kg/m³ (glycerol)
velocity = 0.1  # m/s
characteristic_length = 0.01  # 1 cm
viscosity = 1.412  # Pa·s (glycerol)

Re = reynolds_number(density, velocity, characteristic_length, viscosity)
print(f"Glycerol Reynolds number: {Re:.0f}")Example output
Reynolds number: 9982
Air Reynolds number: 68083
Glycerol Reynolds number: 9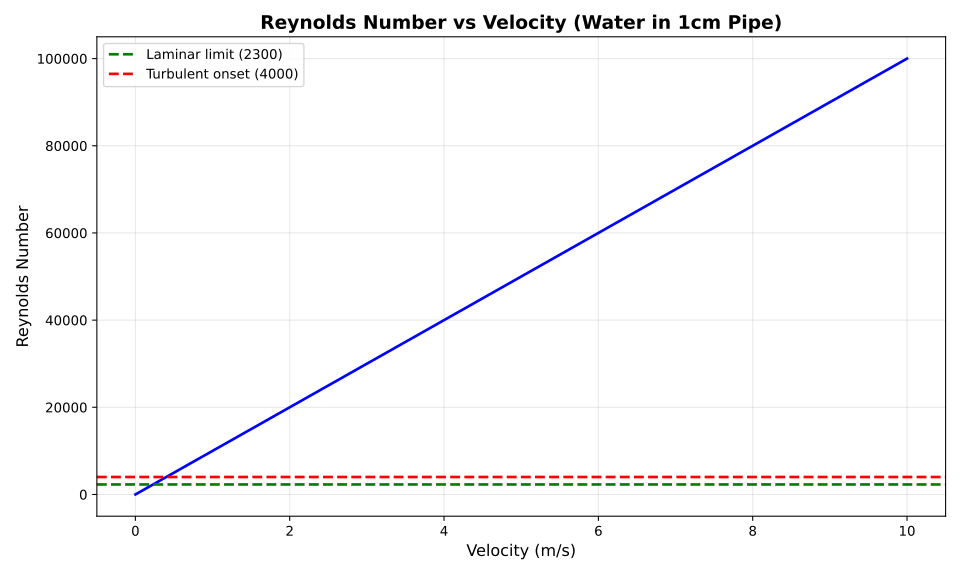
The Reynolds number is given by:
$$ Re = \frac{\rho v L}{\eta} $$where $Re$ is the Reynolds number, $\rho$ is the fluid density, $v$ is the flow velocity, $L$ is the characteristic length (such as pipe diameter), and $\eta$ is the dynamic viscosity.
The Reynolds number indicates whether flow is laminar or turbulent:
- Re < 2300: Laminar flow (smooth, orderly)
- 2300 < Re < 4000: Transitional flow
- Re > 4000: Turbulent flow (chaotic, mixing)
The plot above shows how the Reynolds number varies with velocity for water flowing through a 1 cm diameter pipe. The green dashed line at Re = 2300 marks the transition from laminar to transitional flow, while the red dashed line at Re = 4000 marks the onset of turbulent flow.
The Reynolds number is fundamental to fluid mechanics and is used in pipe flow analysis, aerodynamics, heat transfer, and many other engineering applications. It represents the ratio of inertial forces to viscous forces in a fluid.
Related posts
- How to compute kinematic viscosity in Python using UliEngineering
- How to compute Poiseuille flow rate in Python using UliEngineering
- How to compute Stokes drag in Python using UliEngineering
Plot generation script
#!/usr/bin/env python3
import matplotlib.pyplot as plt
import numpy as np
import sys
sys.path.insert(0, '/home/uli/dev/UliEngineering')

from UliEngineering.Physics.Viscosity import reynolds_number

# Velocity range for plotting
v = np.linspace(0.001, 10, 100)  # 0.001 to 10 m/s

# Create plot
plt.figure(figsize=(10, 6))

# Fixed parameters (water-like flow in a pipe)
density = 1000.0  # kg/m³
characteristic_length = 0.01  # 1 cm (pipe diameter)
viscosity = 0.001  # Pa·s

# Calculate Reynolds number
Re = reynolds_number(density, v, characteristic_length, viscosity)

plt.plot(v, Re, color='blue', linewidth=2)
plt.xlabel('Velocity (m/s)', fontsize=12)
plt.ylabel('Reynolds Number', fontsize=12)
plt.title('Reynolds Number vs Velocity (Water in 1cm Pipe)', fontsize=14, fontweight='bold')
plt.grid(True, alpha=0.3)

# Add laminar/turbulent transition lines
plt.axhline(y=2300, color='green', linestyle='--', linewidth=2, label='Laminar limit (2300)')
plt.axhline(y=4000, color='red', linestyle='--', linewidth=2, label='Turbulent onset (4000)')
plt.legend(loc='upper left', fontsize=10)

plt.tight_layout()
plt.savefig('reynolds_plot.svg', format='svg', dpi=300)
print("Plot saved to reynolds_plot.svg")