
How to compute Henderson-Hasselbalch pH in Python using UliEngineering
You can easily compute the pH using the Henderson-Hasselbalch equation with the UliEngineering Python library:
from UliEngineering.Chemistry import henderson_hasselbalch_pH

# Compute pH for acetic acid buffer (pKa=4.76, ratio=1)
ph = henderson_hasselbalch_pH(4.76, 1.0)
print(f"pH (pKa=4.76, ratio=1): {ph:.2f}")

# Compute pH for buffer with ratio 10 (more conjugate base)
ph = henderson_hasselbalch_pH(4.76, 10.0)
print(f"pH (pKa=4.76, ratio=10): {ph:.2f}")Example output
pH (pKa=4.76, ratio=1): 4.76
pH (pKa=4.76, ratio=10): 5.76The Henderson-Hasselbalch equation relates the pH of a buffer solution to the pKa of the weak acid and the ratio of conjugate base to weak acid. This is fundamental for buffer preparation, understanding acid-base equilibria, and predicting how pH changes with composition in biochemical and chemical systems.
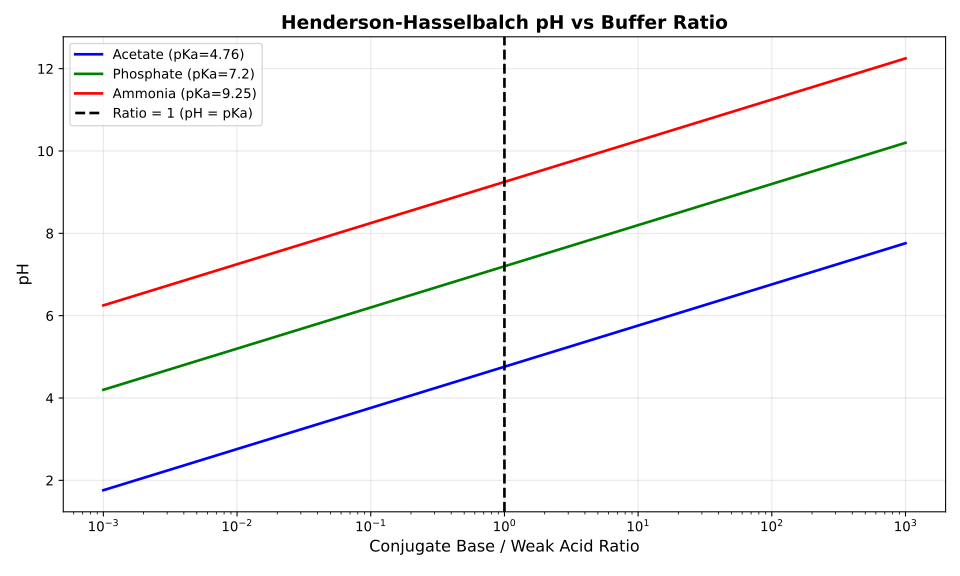
The pH is computed using the formula: $\text{pH} = \text{p}K_a + \log_{10}\left(\frac{[\text{A}^-]}{[\text{HA}]}\right)$, where $\text{p}K_a$ is the acid dissociation constant, $[\text{A}^-]$ is the concentration of the conjugate base, and $[\text{HA}]$ is the concentration of the weak acid. When the ratio equals 1, the pH equals the pKa.
The plot above shows pH versus the conjugate base to weak acid ratio for three different buffer systems on a logarithmic scale. Notice that when the ratio equals 1 (marked by the dashed line), the pH equals the pKa. This demonstrates the linear relationship between pH and the logarithm of the ratio, with a slope of 1. The plot shows how changing the buffer composition shifts the pH predictably based on the pKa of the weak acid.
Related posts
- How to compute Henderson-Hasselbalch ratio in Python using UliEngineering
- How to convert moles to grams in Python using UliEngineering
- How to compute molarity from moles and volume in Python using UliEngineering
Plot generation script
#!/usr/bin/env python3
import matplotlib.pyplot as plt
import numpy as np
import sys
sys.path.insert(0, '/home/uli/dev/UliEngineering')

from UliEngineering.Chemistry.Henderson import henderson_hasselbalch_pH

# Ratio range for plotting (log scale)
ratio = np.logspace(-3, 3, 200)  # 0.001 to 1000

# Create plot
plt.figure(figsize=(10, 6))

# Calculate pH for different pKa values
pKa_values = [4.76, 7.2, 9.25]
colors = ['blue', 'green', 'red']
labels = ['Acetate (pKa=4.76)', 'Phosphate (pKa=7.2)', 'Ammonia (pKa=9.25)']

for pKa, color, label in zip(pKa_values, colors, labels):
    pH = pKa + np.log10(ratio)
    plt.plot(ratio, pH, label=label, color=color, linewidth=2)

plt.xscale('log')
plt.xlabel('Conjugate Base / Weak Acid Ratio', fontsize=12)
plt.ylabel('pH', fontsize=12)
plt.title('Henderson-Hasselbalch pH vs Buffer Ratio', fontsize=14, fontweight='bold')
plt.legend(loc='upper left', fontsize=10)
plt.grid(True, alpha=0.3)

# Mark ratio = 1 (pH = pKa)
plt.axvline(x=1.0, color='black', linestyle='--', linewidth=2, label='Ratio = 1 (pH = pKa)')
plt.legend(loc='upper left', fontsize=10)

plt.tight_layout()
plt.savefig('henderson_hasselbalch_ph_plot.svg', format='svg', dpi=300)