
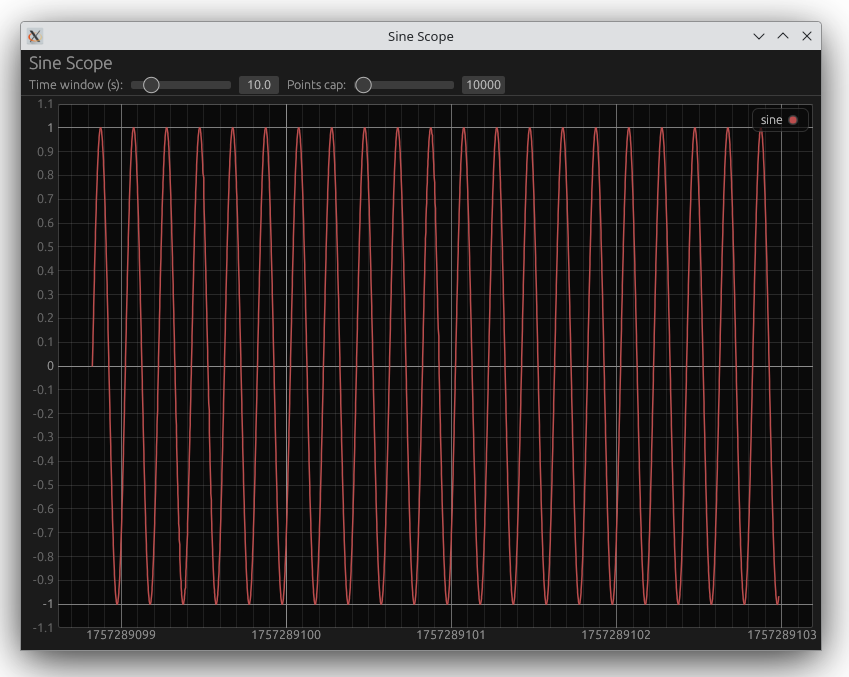
Rust live-plot using gRPC stream source: Minimal example
In our previous post Rust gRPC server stream minimal example we illustrated how to implement a gRPC server in Rust that streams a sine wave signal to a client.
This post builds on the command line client example from Rust gRPC server stream minimal example by implementating a live-updating real-time plot of the incoming sine wave samples using egui_plot.
See Rust gRPC server stream minimal example for all files not shown here.
examples/plot.rs
live_plot.rs
use std::{collections::VecDeque, time::Duration};
use eframe::{self, egui};
use egui_plot::{Plot, Line, Legend, PlotPoints};
use std::sync::mpsc::Receiver;
use std::thread;

// gRPC client imports
use tonic::Request;

pub mod sine { pub mod v1 { tonic::include_proto!("sine.v1"); } }
use sine::v1::{sine_wave_client::SineWaveClient, SubscribeRequest, Sample as GrpcSample};

// Define ScopeApp struct
pub struct ScopeApp {
    pub rx: Receiver<Sample>,
    pub buffer: VecDeque<[f64; 2]>,
    pub max_points: usize,
    pub time_window: f64,
    pub last_prune: std::time::Instant,
}

// Sample struct matching gRPC Sample
#[derive(Debug, Clone)]
pub struct Sample {
    pub index: u64,
    pub value: f64,
    pub timestamp_micros: i64,
}
impl eframe::App for ScopeApp {
    fn update(&mut self, ctx: &egui::Context, _frame: &mut eframe::Frame) {
        // Pull in any new samples available
        while let Ok(sample) = self.rx.try_recv() {
            // Use timestamp (in seconds) as t, value as y
            let t = sample.timestamp_micros as f64 * 1e-6;
            let y = sample.value;
            self.buffer.push_back([t, y]);
            if self.buffer.len() > self.max_points {
                self.buffer.pop_front();
            }
        }

        // Periodically prune to keep only the most recent time window
        if self.last_prune.elapsed() > Duration::from_millis(200) {
            if let Some((&[t_latest, _], _)) = self.buffer.back().map(|x| (x, ())) {
                let cutoff = t_latest - self.time_window;
                while let Some(&[t, _]) = self.buffer.front() {
                    if t < cutoff {
                        self.buffer.pop_front();
                    } else {
                        break;
                    }
                }
            }
            self.last_prune = std::time::Instant::now();
        }

    // Build the plot points
    let points: PlotPoints = self.buffer.iter().map(|&[t, y]| [t, y]).collect();
    let line = Line::new("sine", points);

    egui::TopBottomPanel::top("controls").show(ctx, |ui| {
            ui.heading("Sine Scope");
            ui.horizontal(|ui| {
                ui.label("Time window (s):");
                ui.add(egui::Slider::new(&mut self.time_window, 1.0..=60.0));
                ui.label("Points cap:");
                ui.add(egui::Slider::new(&mut self.max_points, 5_000..=200_000));
            });
        });

        egui::CentralPanel::default().show(ctx, |ui| {
            Plot::new("scope_plot")
                .legend(Legend::default())
                .allow_scroll(false)
                .allow_zoom(true)
                .allow_boxed_zoom(false)
                .show(ui, |plot_ui| {
                    plot_ui.line(line);
                });
        });

        // Continuously repaint so it feels real-time
    ctx.request_repaint_after(Duration::from_millis(16));
    }
}

// Add a main function to launch the app and start gRPC client in background
fn main() {
    let (tx, rx) = std::sync::mpsc::channel();

    // Spawn a background thread to run the async gRPC client
    thread::spawn(move || {
        let rt = tokio::runtime::Runtime::new().unwrap();
        rt.block_on(async move {
            let mut client = match SineWaveClient::connect("http://127.0.0.1:50051").await {
                Ok(c) => c,
                Err(e) => {
                    eprintln!("Failed to connect to gRPC server: {e}");
                    return;
                }
            };
            let mut stream = match client.subscribe(Request::new(SubscribeRequest{})).await {
                Ok(resp) => resp.into_inner(),
                Err(e) => {
                    eprintln!("Failed to subscribe: {e}");
                    return;
                }
            };
            while let Ok(Some(sample)) = stream.message().await {
                let sample = Sample {
                    index: sample.index as u64,
                    value: sample.value,
                    timestamp_micros: sample.timestamp_micros,
                };
                if tx.send(sample).is_err() {
                    break;
                }
            }
        });
    });

    let app = ScopeApp {
        rx,
        buffer: VecDeque::new(),
        max_points: 10_000,
        time_window: 10.0,
        last_prune: std::time::Instant::now(),
    };
    let native_options = eframe::NativeOptions::default();
    eframe::run_native(
        "Sine Scope",
        native_options,
        Box::new(|_cc| Ok(Box::new(app))),
    ).unwrap();
}Cargo.toml
Cargo.toml
[package]
name = "sine_scope_client"
version = "0.1.0"
edition = "2021"

[dependencies]
# gRPC
tonic = { version = "0.12", features = ["tls"] }
prost = "0.13"
prost-types = "0.13"

# Async runtime
tokio = { version = "1.39", features = ["rt-multi-thread", "macros", "sync"] }

# GUI

# egui_plot ships as a module of egui in recent versions, but we use the crate for explicit versioning
# For channels between async task and UI
futures = "0.3"
eframe = "0.32.2"
egui = "0.32.2"
egui_plot = "0.33.0"

[build-dependencies]
tonic-build = "0.12"How to run
example.sh
cargo run --example plotIf this post helped you, please consider buying me a coffee or donating via PayPal to support research & publishing of new posts on TechOverflow